The CBH Flexi-starter Pool objective
WIth CBH Flexi-starter, growers can contract tonnes early in the growing season and adjust those tonnes higher or lower within a nominated timeframe, depending on how the season is progressing.
By leveraging CBH's supply chain and end-user networks, growers can access greater marketing opportunities and capture full margins for their grain. CBH's grain trading professionals manage price risk and market volatility within sophisticated risk management strategies. The pool objective is to actively manage and trade exposures with the aim to enhance prices.
Features
-
Flex your tonnage
-
Availability
-
Standard Grades
-
Nomination and Delivery
-
Quality: Wheat and Canola
-
Payment schedule
We offer five flexible payment methods to suit the needs of your farm business.
Past performance
The CBH Flexi-starter pool has delivered outstanding and reliable results since 2018-19, outperforming the average cash price in all zones.
-
View 2022-23 results
The 2022-23 CBH Flexi -Starter Pools recently finalised and returned outstanding results to participants.
The Wheat Flexi-Starter Pool has delivered another strong result with its final pool return (ASW1) outperforming the average cash price by $60 - $80 per tonne and outperforming the average cash price over the harvest period by $67 - $92 per tonne.
This is the second season for the Barley Flexi-Starter Pool and the result remains strong with the final pool return (BFD1) outperforming the average cash price by $70 - $85 per tonne and the average cash price over the harvest period by $74 - $96 per tonne.
Final ResultsWheat
These results are for ASW1 FIS for each port zone.ZONE
FINAL EQUITY - ASW1 FIS
AVERAGE QUALITY - ASW FIS
TOTAL EQUITY - ASW1 FIS
Geraldton
$432.14 $5.24 $437.38 Kwinana $431.84 $5.54 $437.38 Albany $430.15 $4.36 $434.51 Esperance $429.23 $3.88 $433.11 


Barley
These results are for BFD1 FIS for each port zone.Zone FINAL EQUITY -BFD1 FIS Geraldton $394.19 Kwinana $400.07 Albany $397.19 Esperance $396.10 


 Pool Strategy
Given the Russia-Ukraine conflict was still heavily impacting markets when the Flexi-starter pools opened, there was a clear strategy to maximise sales into export markets throughout the life of both the wheat and barley pools. As the season progressed global physical markets remained supported due to ongoing supply concerns. However local markets remained generally subdued as a result of the prior season's surplus carry-out and the prospect of another strong production season creating a burdensome carryout for the 22/23 production year.
Whilst global markets pricing did correct lower throughout the marketing season, physical basis improved which saw pool equity remain relatively well supported given the accelerated sales profile, and led to the strong performance by both products this season. -
View 2021-22 results
26 May 2022
The 2021-22 CBH Flexi-starter Pool has returned record results for participants
The Flexi-starter pool has delivered outstanding returns for growers who contracted to the pre-season pool with both wheat and barley. These results build on strong previous returns for wheat and an impressive inaugural season for feed barley. This season, the wheat pool has delivered participants returns between $54-$64 above the average prices over the marketing window, and outperformed the average cash prices over the harvest period between $84-$109 per tonne.
The barley Flexi-starter outperformed the average cash price by $45-$65 per tonne and delivered returns between $71-$105 higher than the average cash price over the harvest period per tonne depending on the zone. A brilliant result for the first season featuring feed barley.
Final Results
These results are for ASW1 FIS for each port zone.
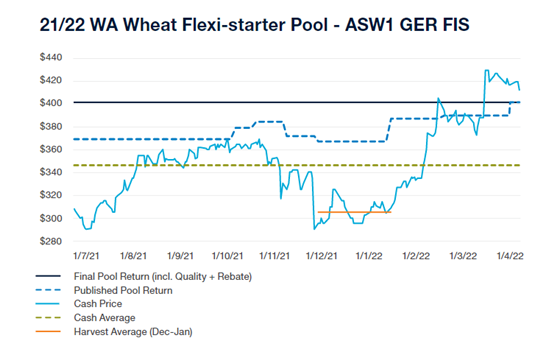
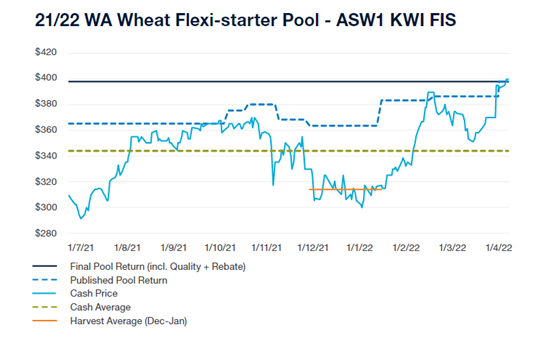
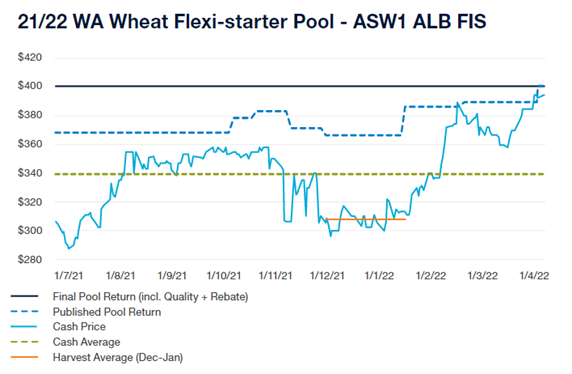
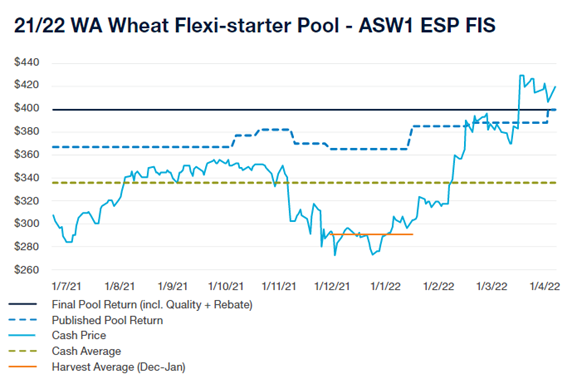
Zone Final Equity - ASW1 FIS Average Quality - ASW1 FIS Total Equity - ASW1 FIS Geraldton $416.59 p/t $5.06 p/t $401.77 p/t Kwinana $416.59 p/t $5.62 p/t $398.11 p/t Albany $416.59 p/t $4.72 p/t $401.09 p/t Esperance $416.59 p/t $4.68 p/t $399.82 p/t Geraldton zone
ASW1 GER outperformed average cash prices by $55 per tonne over the pool lifecycle. The chart below shows ASW1 results.

Kwinana zone
ASW1 KWI outperformed average cash prices by $54 per tonne over the pool lifecycle. The chart below shows ASW1 results.

Albany zone
ASW1 ALB outperformed average cash prices by $62 per tonne over the pool lifecycle. The chart below shows ASW1 results.

Esperance zone
ASW1 ESP outperformed average cash prices by $64 per tonne over the pool lifecycle. The chart below shows ASW1 results.

Pool Strategy
Given a divergence between the local factors influencing cash prices and global drivers of international prices, the expectation was that international values would deliver the best returns across the marketing window. Thus, the pool had a clear strategy to execute all sales where possible via the export program in order to maximise potential value capture.
From an international market perspective, global prices remained relatively well supported over the season, mainly due to the Russian export tax and concerns around Northern Hemisphere production. Strong global demand for Australian record crop saw the available shipping capacity committed much further out the curve than normal. This explains the more accelerated nature of the Flexi-Starter sales program from October onwards as global values maintained their climb higher and elevation margins began to widen as the size of the local oversupply, and hence the magnitude of the likely capacity constraint, became apparent. In late February, global markets shifted violently higher again when Russia invaded Ukraine, creating significant uncertainty around the availability of exports from two of the largest global suppliers. Whilst the marketing program was well advanced by this stage, the pool was able to capture additional premiums on its remaining uncommitted stocks.
Pool equity additionally benefited from a currency which generally trended lower from July through to February. Given the trend, hedging activity was initially focused on remaining under-hedged and maximising any dips to step in and hedge exposures, however the strategy pivoted towards building an over-hedged position through November when AUDUSD materially shifted lower. As a result, pool equity was well protected from the appreciation in AUD which occurred from February onwards, seeing the currency back towards the 0.7650 season-highs by late March.
*All figures mentioned above assume the distribution payment method and take into account S&H charges. Different payment methods may incur financial costs. Please check the Pool Calculator for full details. Cash price comparisons use Profarmer published cash price data.
-
View 2020-21 results
11 May 2021
The 2020-21 CBH Flexi-starter Pool recently finalised and returned another good result for participants.
This is the third season we have run the Flexi-starter Pool, and pleasingly it has managed to deliver another strong result for participants. This season, the pool has delivered participants returns between $10-$14 above the average prices over the marketing window, with a similar outperformance when compared to the average of prices over the harvest period.
Final Results
These results are for APW1 FIS for each port zone.
Zone Final Equity - APW1 FOB Average Qualtiy - APW1 FIS Total Equity - APW1 FIS Geraldton $348.52 p/t $4.70 p/t $332.92 p/t Kwinana $348.52 p/t $5.70 p/t $334.45 p/t Albany $348.52 p/t $5.00 p/t $331.83 p/t Esperance $348.52 p/t $3.80 p/t $329.81 p/t Geraldton zone
APW1 GER outperformed average cash prices by $11.74 per tonne over the pool lifecycle. The chart below shows APW1 results.

Kwinana zone
APW1 KWI outperformed average cash prices by $10.67 per tonne over the pool lifecycle. The chart below shows APW1 results.

Albany zone
APW1 ALB outperformed average cash prices by $11.14 per tonne over the pool lifecycle. The chart below shows APW1 results.

Esperance zone
APW1 ESP outperformed average cash prices by $13.77 per tonne over the pool lifecycle. The chart below shows APW1 results.

Pool Strategy
Over the period the pool was able to capture elevation margins (premiums achieved by exporting the grain) which existed for a large part of the marketing window. This was through sending majority of sales into export markets, selling direct to key end-user customers and capturing full premiums for grain under management.
On the flip-side, this strategy has meant the pool has been impacted by the supply chain challenges experienced more recently here in WA, however due to the accelerated nature of this pool it has not had a material impact on the result.
*All figures mentioned above assume the distribution payment method and take into account S&H charges. Different payment methods may incur financial costs. Please check the Pool Calculator for full details. Cash price comparisons use Profarmer published cash price data.
-
View 2019-20 results
21 May 2020
The 2019-20 CBH Flexi-starter Pool recently finalised and returned a fantastic result for participants.
The pool performed around $35-$40 per tonne better than the average cash price over the marketing window, and nearly $15-20 per tonne better than the average of cash prices over the harvest period.
Using Kwinana zone as an example, the final pool result was better than the cash price prevailing for 93% of the daily observations, meaning for a grower to achieve the same or better outcome they would have had to sell grain on the 7% of days the cash price was better than the pool result.
2019 was the second year CBH offered the pre-harvest pool, and both years have seen excellent returns to growers.
Final Results
These results are for APW1 FIS for each port zone.
Zone Final Equity - APW1 FIS Average Qualtiy - APW1 FIS Total Equity - APW1 FIS Geraldton $370.82 p/t $6.35 p/t $377.17 p/t Kwinana $371.39 p/t $5.70 p/t $377.09 p/t Albany $369.52 p/t $5.30 p/t $374.82 p/t Esperance $368.72 p/t $5.30 p/t $374.02 p/t Geraldton zone
APW1 GER outperformed average cash prices by $38.39 per tonne over the pool lifecycle. The chart below shows APW1 results.

Kwinana zone
APW1 KWI outperformed average cash prices by $37.06 per tonne over the pool lifecycle. The chart below shows APW1 results.

Albany zone
APW1 ALB outperformed average cash prices by $37.93 per tonne over the pool lifecycle. The chart below shows APW1 results.

Esperance zone
APW1 ESP outperformed average cash prices by $40.00 per tonne over the pool lifecycle. The chart below shows APW1 results.

Pool Strategy
CBH undertook a delayed selling strategy to take advantage of potential post-harvest tightness and was able to capture the benefit of favourable currency and commodity price movements as the season progressed.
*All figures mentioned above assume the distribution payment method and take into account S&H charges. Different payment methods may incur financial costs. Please check the Pool Calculator for full details. Cash price comparisons use Profarmer published cash price data.
-
View 2018-19 results
24 April 2019
The 2018-19 Flexi-starter pool has been finalised and all remaining equity has been paid to participants of the pool.
This was the first year that CBH has run this product and the final result is a great outcome for participants, once again demonstrating the benefits of using pools as part of a well-diversified grain marketing strategy to spread your income and risk.
Final Results
These results are for APW1 FIS for each port zone.Zone Final Equity - APW1 FIS Average Qualtiy - APW1 FIS Total Equity - APW1 FIS Geraldton $354.94 p/t $4.70 p/t $359.64 p/t Kwinana $355.11 p/t $5.80 p/t $360.91 p/t Albany $353.24 p/t $4.50 p/t $357.74 p/t Esperance $352.44 p/t $4.20 p/t $356.64 p/t We've also included the results for ASW1 FIS for each port zone as the majority of tonnes in the pool were ASW1.Zone Final Equity - APW1 FIS Average Qualtiy - APW1 FIS Total Equity - APW1 FIS Geraldton $342.94 p/t $5.00 p/t $347.94 p/t Kwinana $343.11 p/t $5.90 p/t $349.01 p/t Albany $340.41 p/t $4.70 p/t $345.11 p/t Esperance $340.44 p/t $3.90 p/t $344.34 p/t Geraldton zone
APW1 GER outperformed average cash prices by $11.48 per tonne and ASW1 by $14.51 per tonne over the pool lifecycle. The chart below shows APW1 results.

Kwinana zone
APW1 KWI outperformed average cash prices by $6.84 per tonne and ASW1 by $12.85 per tonne over the pool lifecycle. The chart below shows APW1 results.

Albany zone
APW1 ALB outperformed average cash prices by $8.30 per tonne and ASW1 by $13.51 per tonne over the pool lifecycle. The chart below shows APW1 results.

Esperance zone
APW1 ESP outperformed average cash prices by $10.65 per tonne and ASW1 by $14.86 per tonne over the pool lifecycle. The chart below shows APW1 results.

Pool Strategy
The strategy for the pool included utilising the track market for pre-harvest sales. This proved quite effective with the pool achieving some good levels for sales, which supported a solid final result.
The pool benefited from the strategy of delaying ASW sales until the post-harvest period as much as possible. Whilst spreads pushed out to around a $40 discount for ASW at stages when the APW price was peaking, the pool was able to deliver a much better outcome to participants by utilising tonnes on export vessels and taking advantage of the narrowing spread post-harvest. This was important since ASW tonnes made up the majority of the pool tonnes this season.
*All figures mentioned above assume the distribution payment method and take into account S&H charges. Different payment methods may incur financial costs. Please check the Pool Calculator for full details. Cash price comparisons use Profarmer published cash price data.
Documents
Pool Fact Sheets
Related pages
-
WA Harvest PoolsRead more about WA Harvest Pools
-
Deferred Sales PoolRead more about Deferred Sales Pool
-
PoolsRead more about Pools


